Measurement overview
Lowther driver data 2024/5
Our units are tested under the following conditions:
- Frequency SPL (dB) graphs generated from REW
- Impedance, phase and T/S parameters from Dayton DATS v3
REW parameters
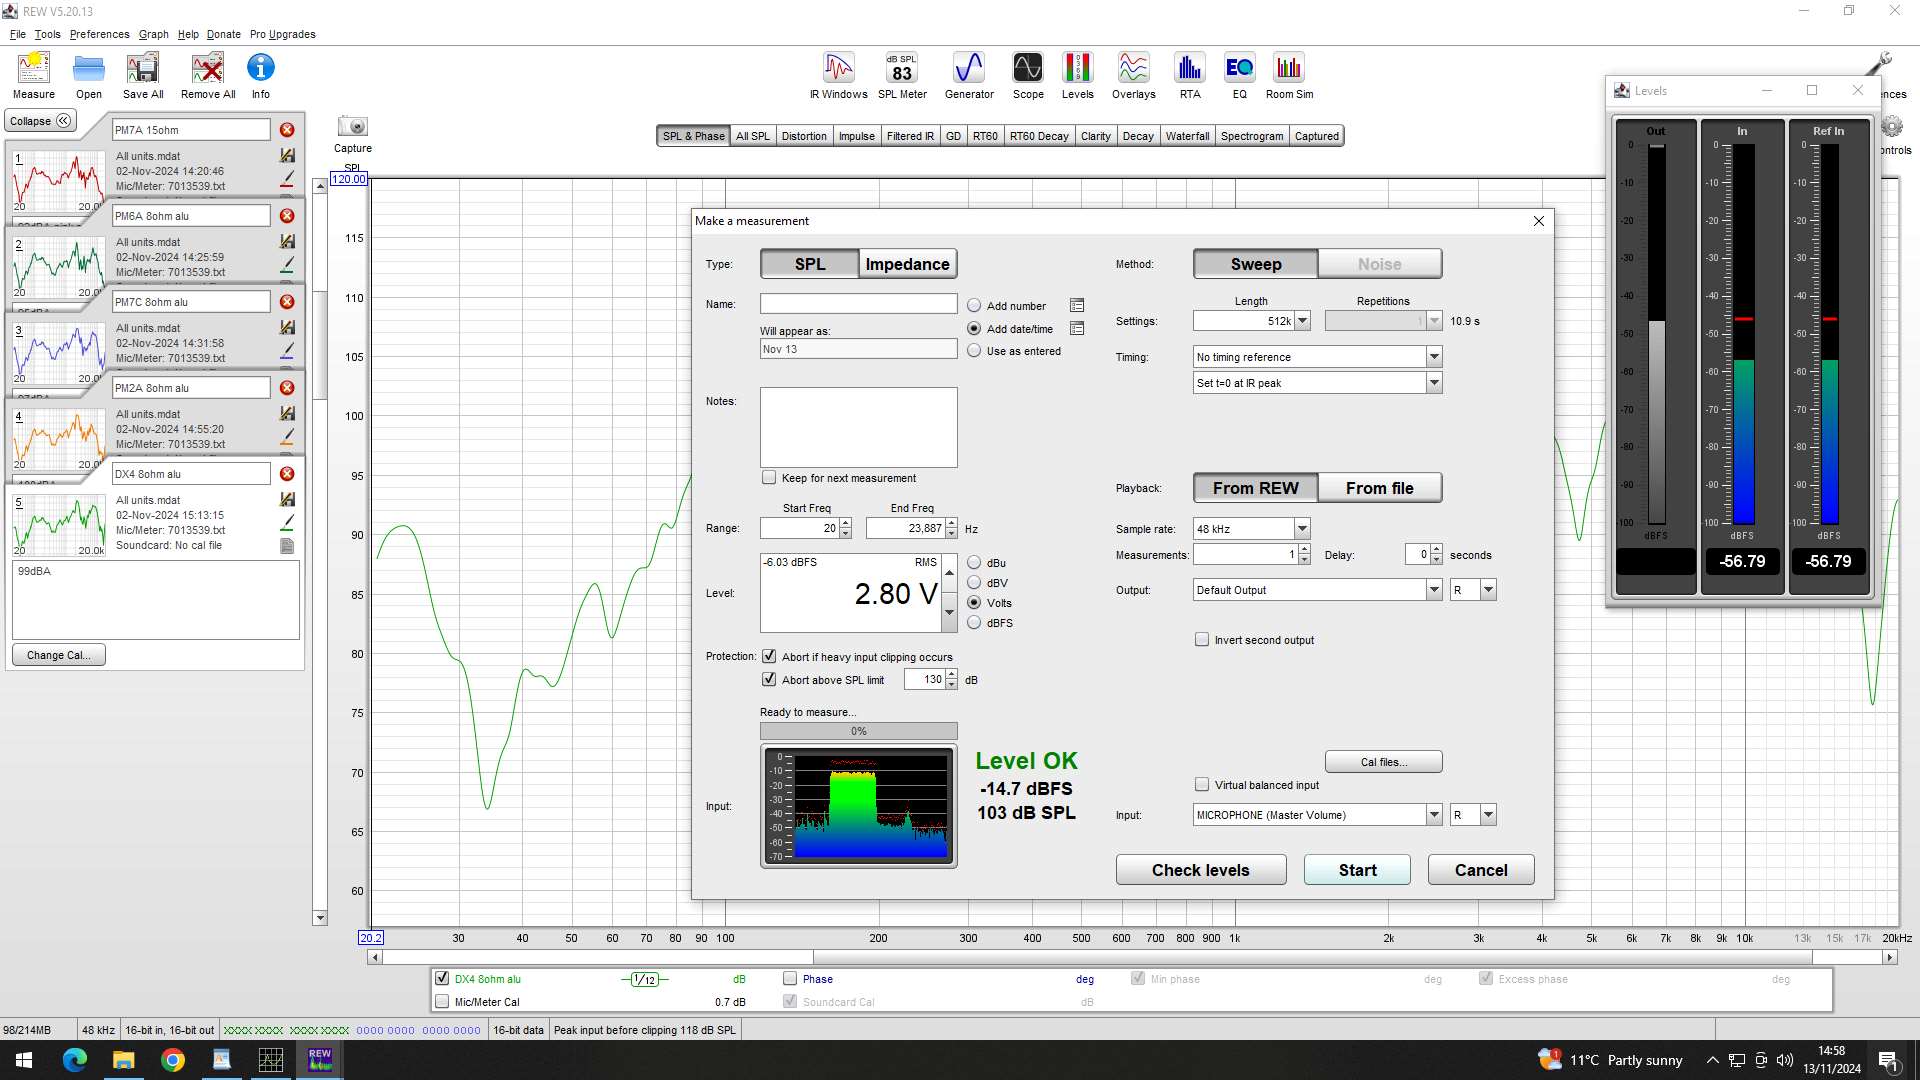
We use a swept tone from 20 Hz to 20 kHz. Each driver is mounted on a free-air baffle, facing into a dead chamber, with a miniDSP UMIK-1 microphone at 1 m on axis.
Amplifier output is set at 1.0 V for best accuracy. (See efficiency rating notes below.) Graphs use 1/12 smoothing.
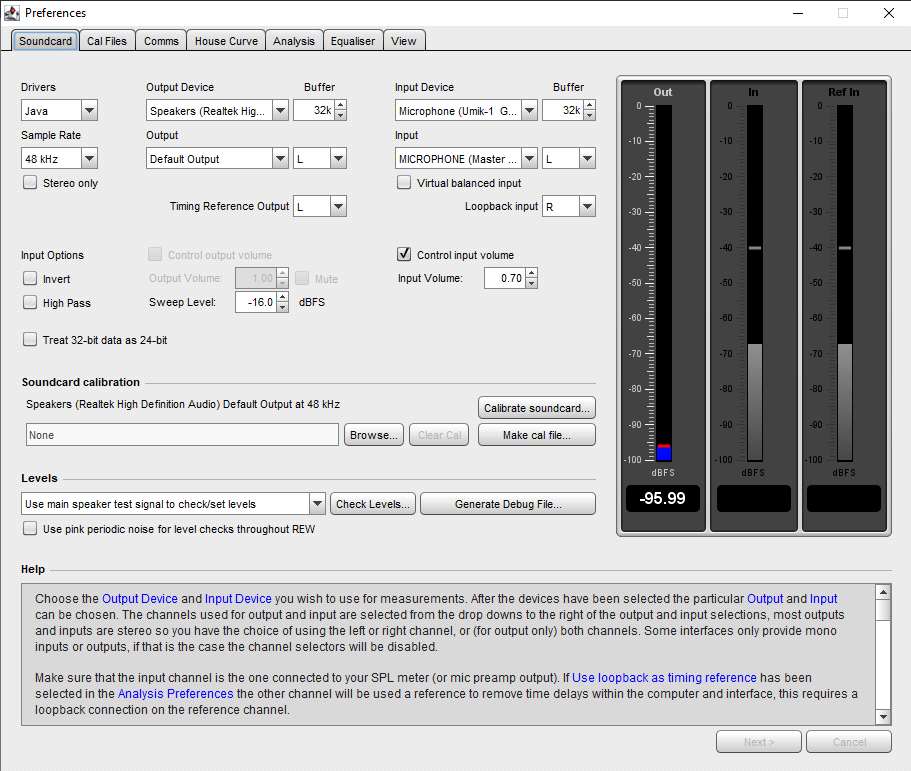
Preferences and measurement settings are shown in the REW screenshots.
Standard calibration
We also test with 500 Hz to 2000 Hz pink noise at 1 V to assess nominal efficiency rating. We re-calibrate to allow for the difference in output between a 1 kHz tone and pink noise. This ensures the AC meter reads the correct output at the amplifier terminals.
In the example below, the application output is set at 1.17 V for pink noise. The actual amplifier reading at the meter is 1 V, so this PM6A Concert driver on test is quoted at 95.7 dBA at 1 V between 500 Hz and 2000 Hz.
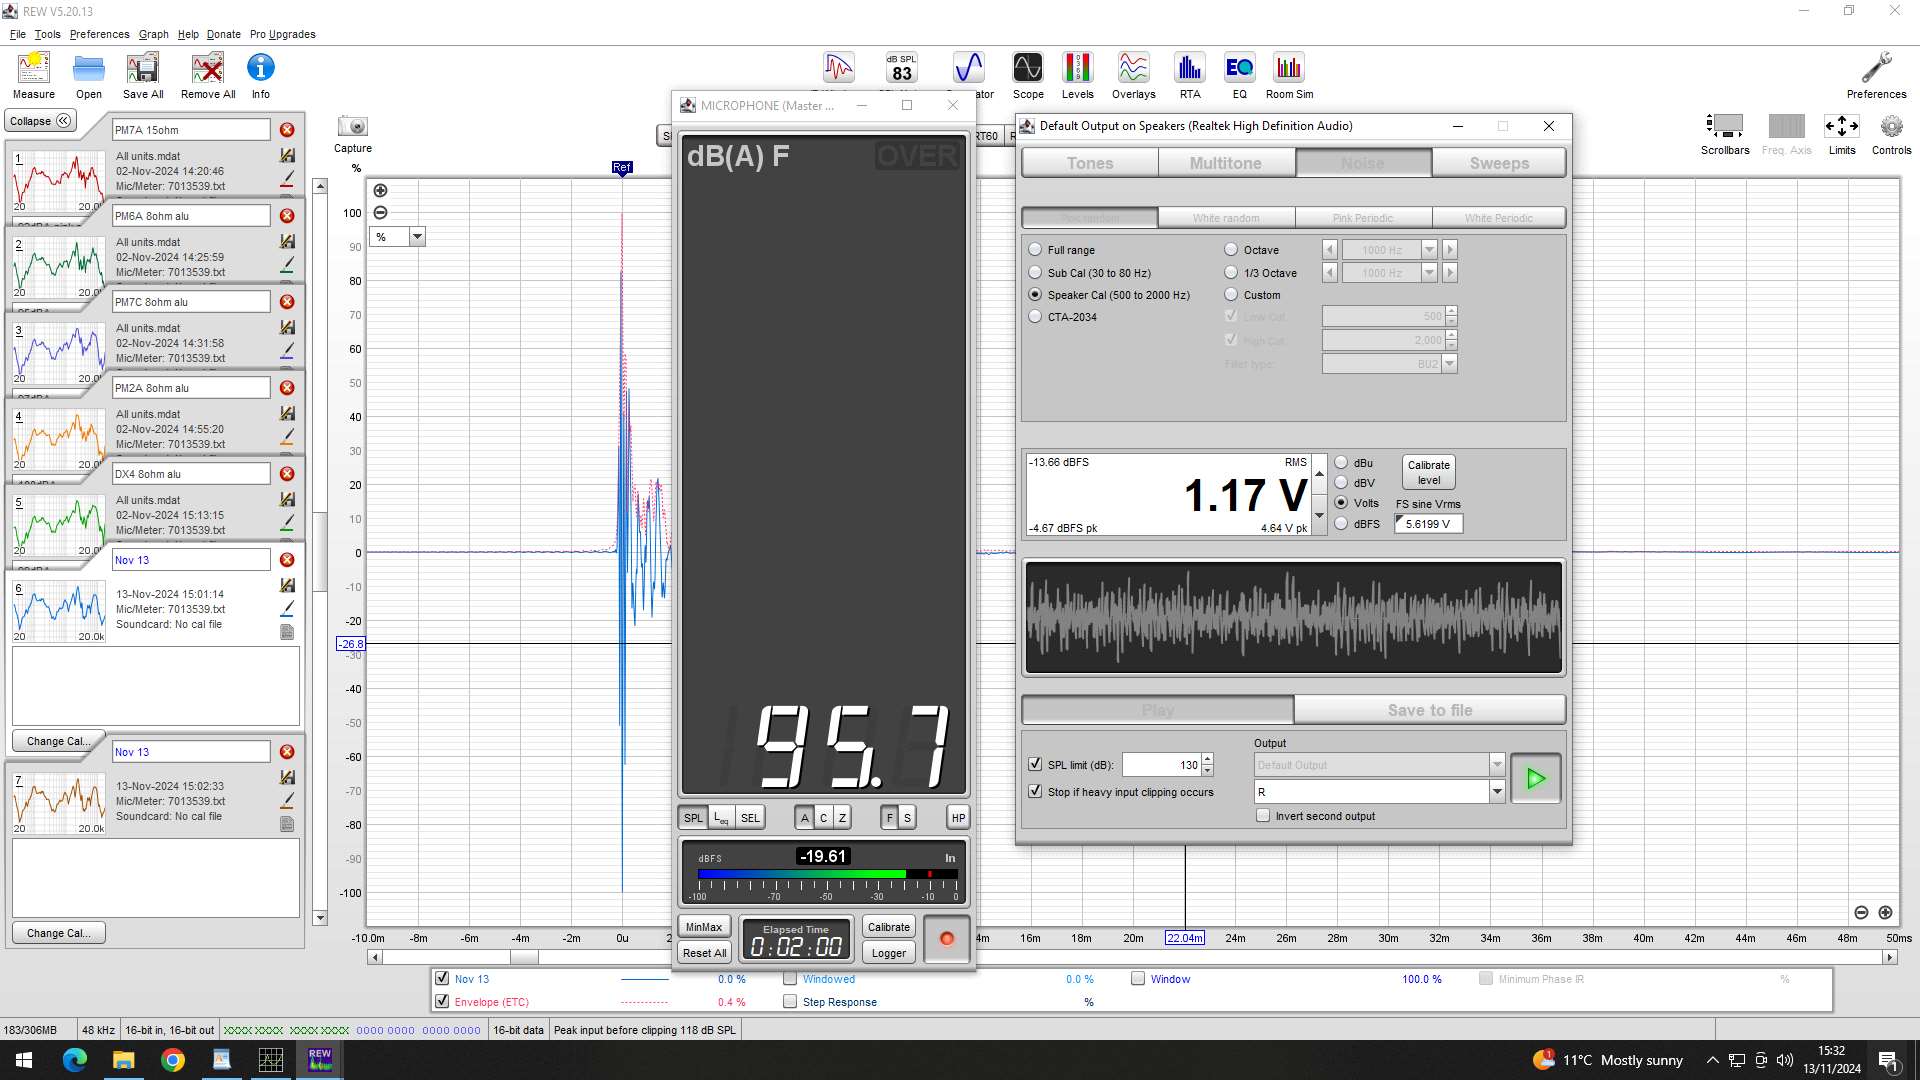
The same PM6A driver measured at 2.8 V reads 104 dBA. This is too loud to collect meaningful comparative data across the full Lowther range with this application, so we use 1 V as the working standard and allow for the offset when required.
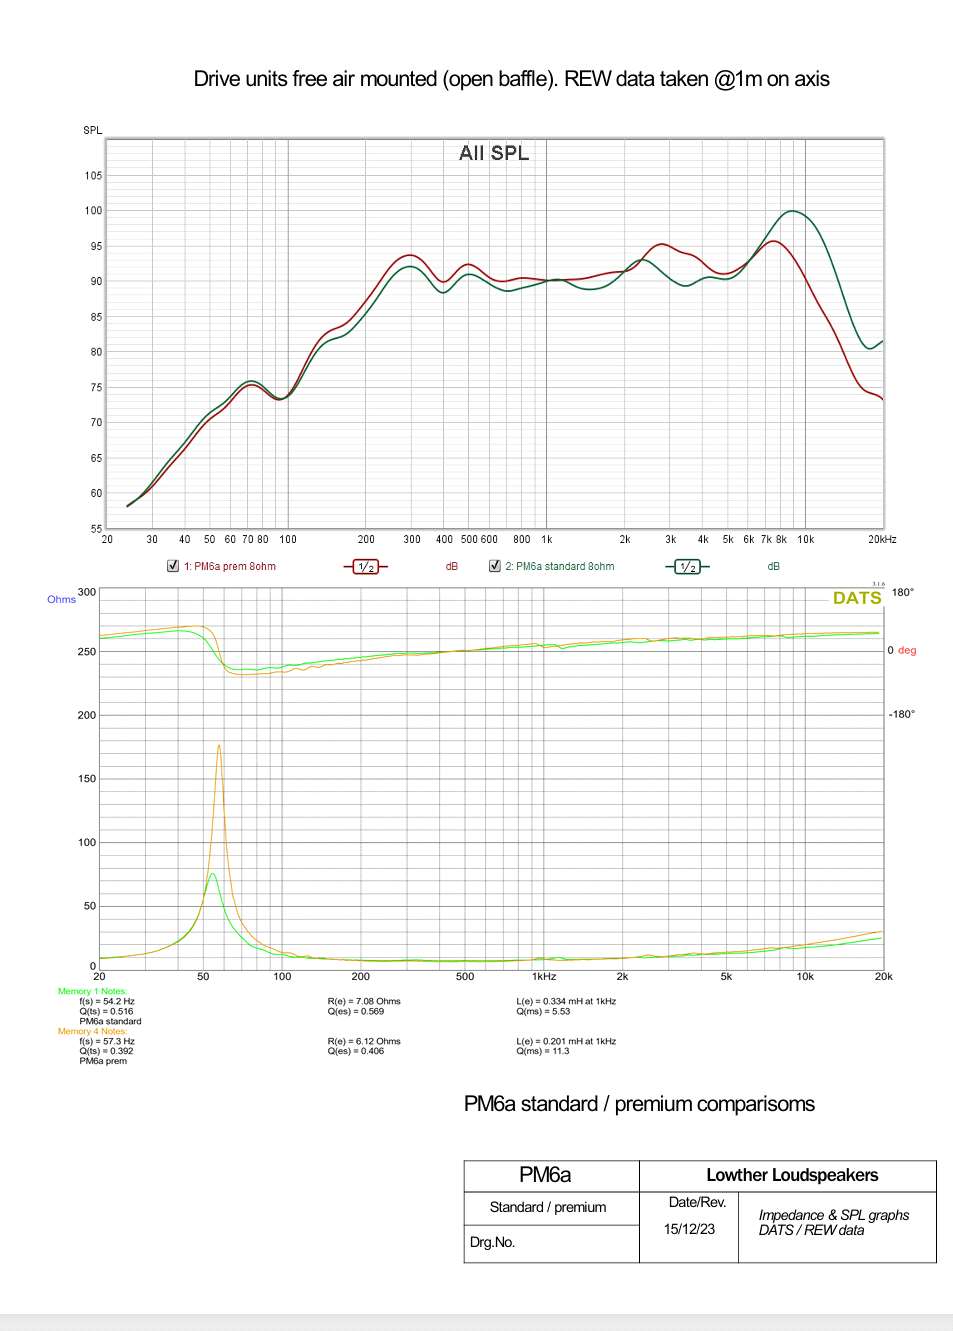
To give a baseline comparison, the PM6A 8 Ω aluminium coil unit is shown tested at both 1 V and 2.8 V, which gives a nominal 8 dB offset.

Impulse response and free-air parameters
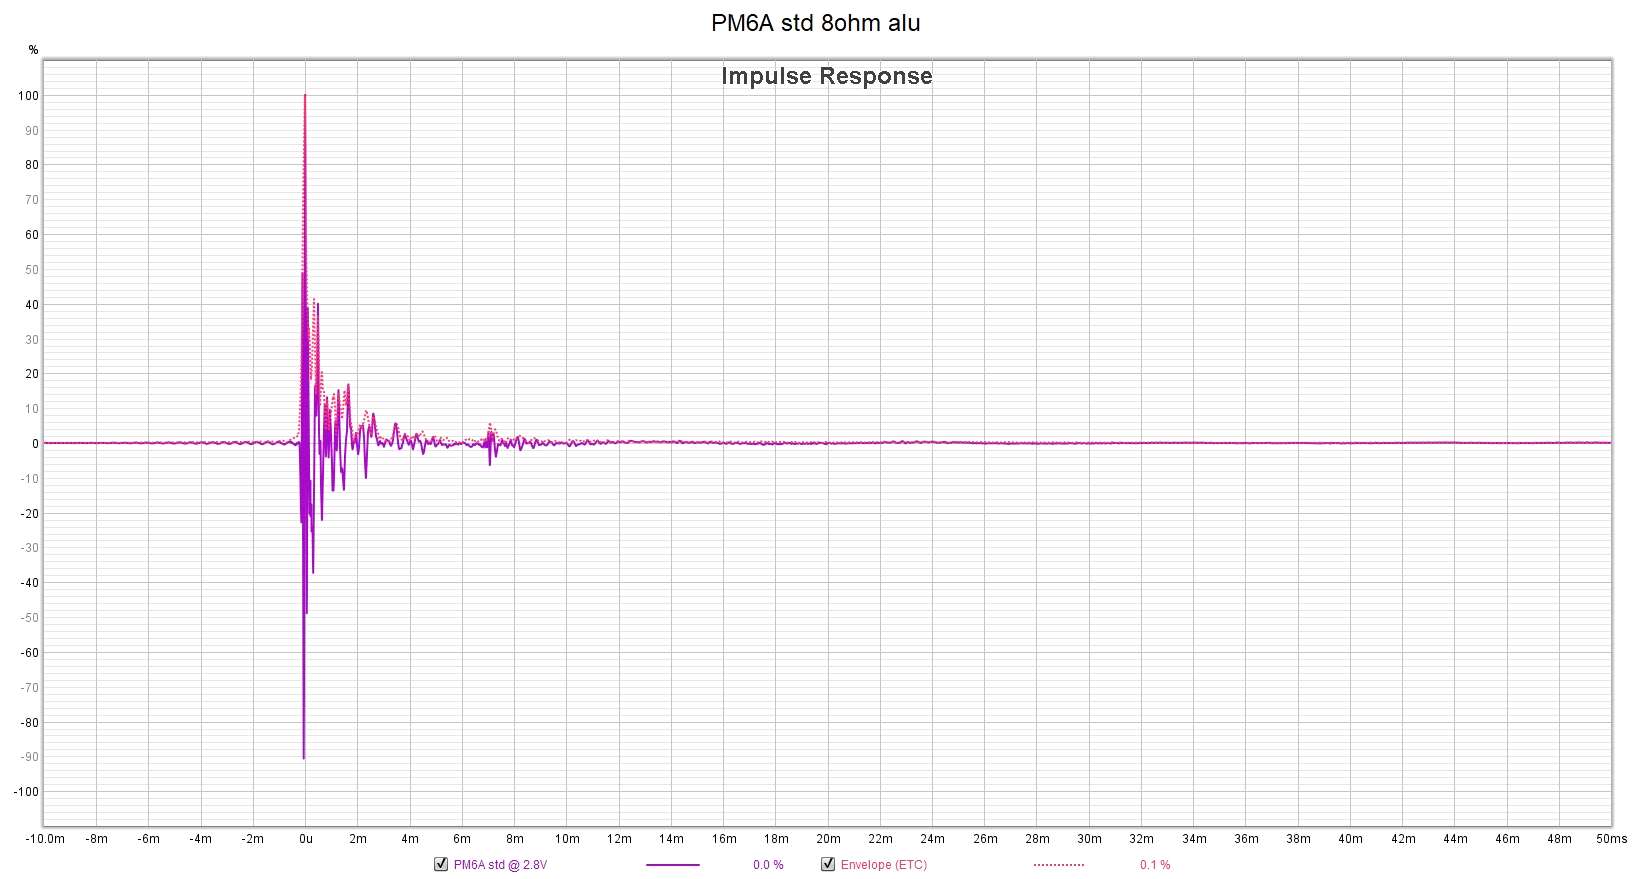
Impulse response measurement
The impulse response for the entire Lowther range is extremely consistent. The standard PM6A is representative of the behaviour of the family.
Because the plots are so similar, publishing each variant is unnecessary. Individual impulse response plots can be generated from the database and supplied on request for specific drivers. For most customers the data has limited value. It simply confirms that all Lowther units are very responsive by design.
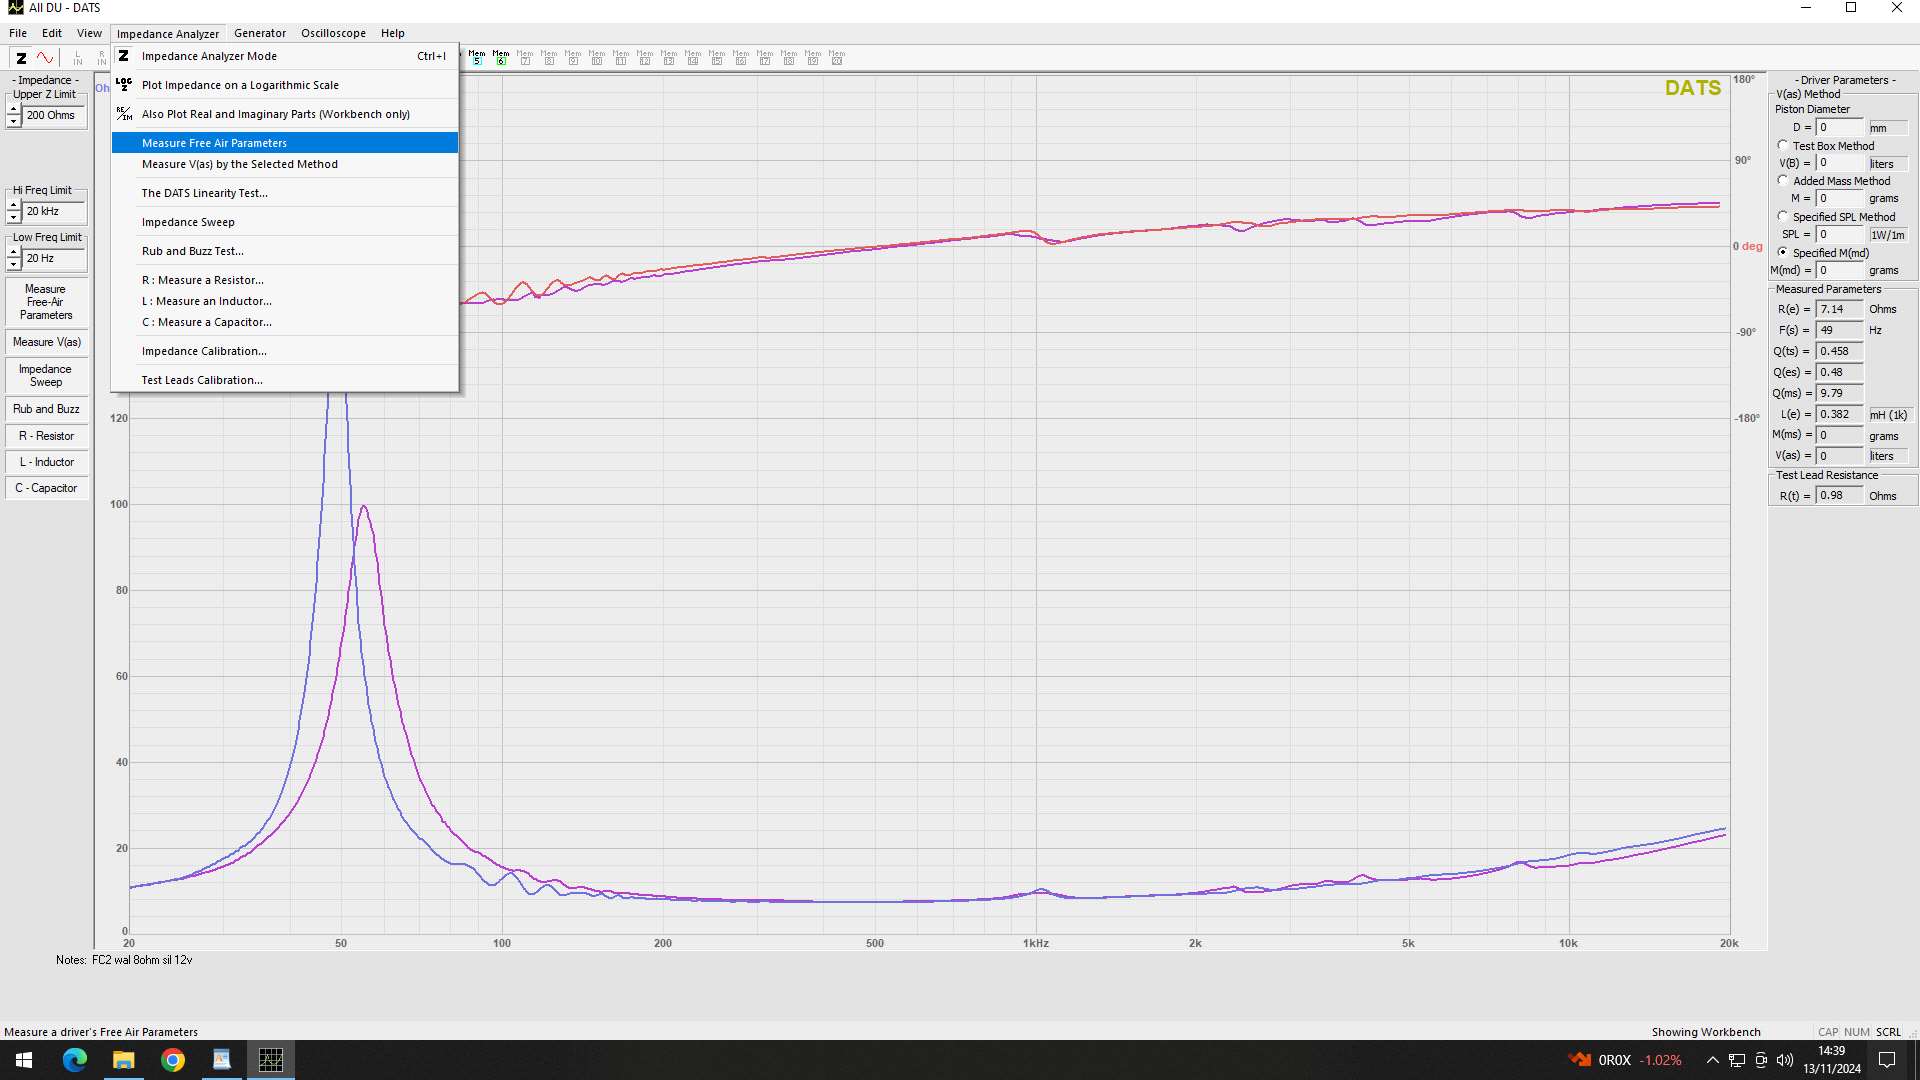
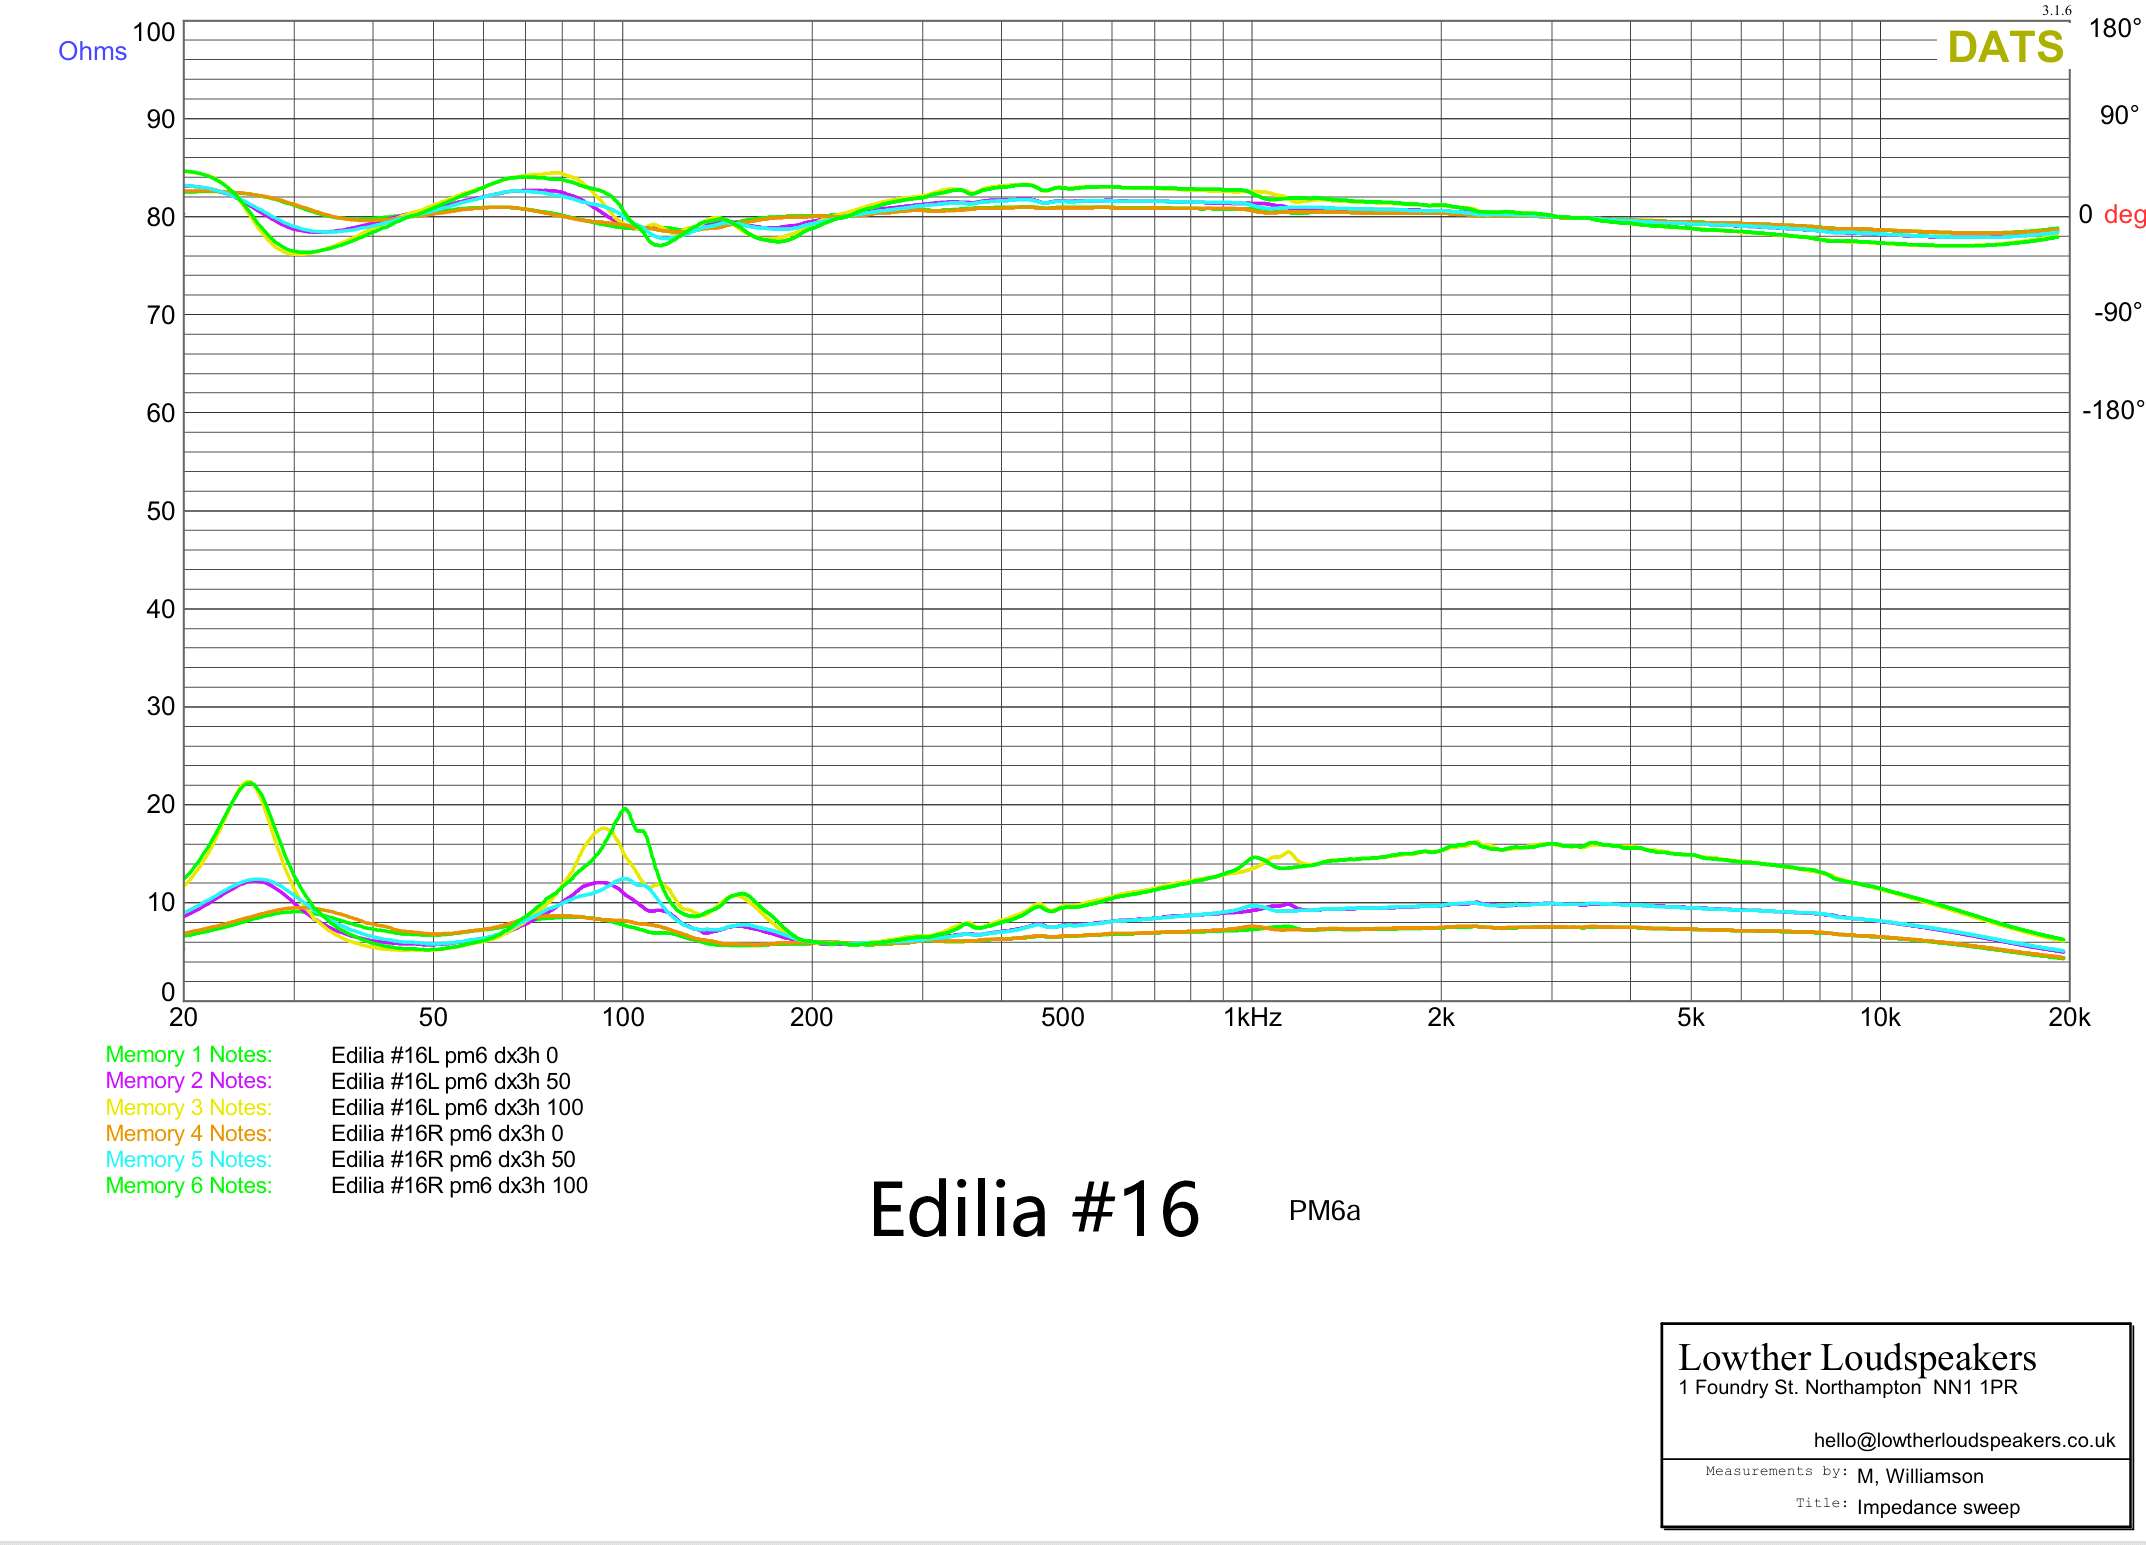
Free-air parameters and impedance sweep
T/S parameters and impedance / phase graphs are generated from Dayton DATS v3 under the same mounted conditions as the SPL and frequency response measurements.
Whole-system cabinet measurements
Response graphs are also generated for completed handmade to order bespoke cabinets, so that left and right speakers can be matched.
How to interpret the data
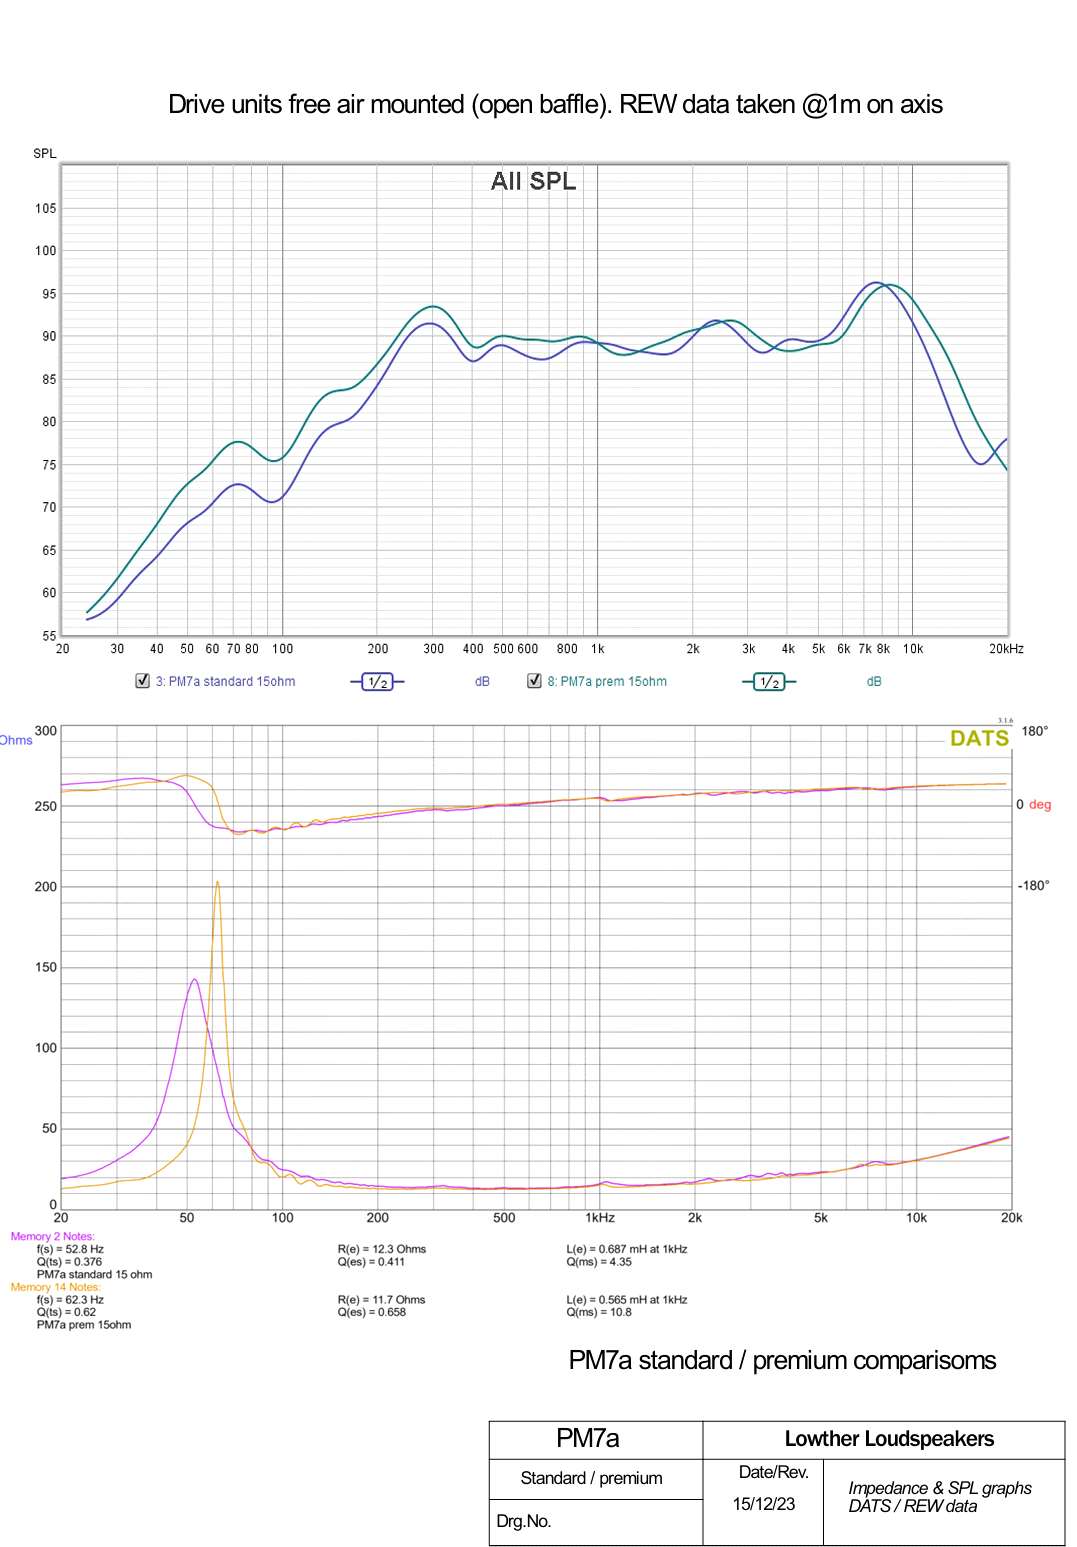
The following graphs show PM6 and PM7 units in Concert and Sinfonia (standard and premium) variants. It is important to use the information with a clear understanding of what it can and cannot tell the end user.
For example, the low-frequency resonance (Fs) of the Sinfonia appears higher in the impedance plot. Taken in isolation this could suggest less bass output. In practice this does not correlate with the SPL frequency graph. The narrowness of the resonance peak is far more important to the quality of the bass response when the driver is correctly horn loaded.
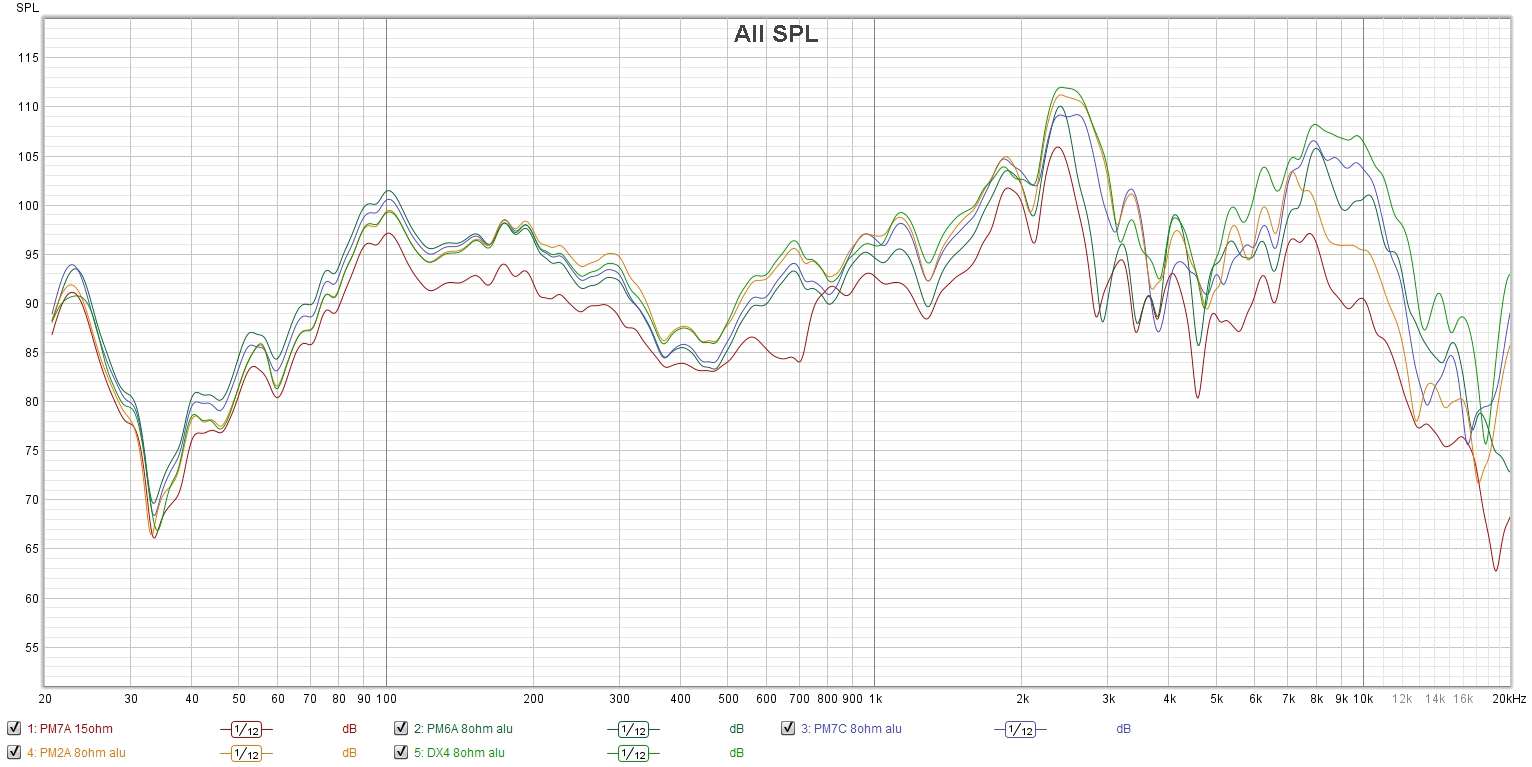
Comparative illustrations
Here is a selection of Concert units showing comparative responses, as measured before. We are often asked for "dB sensitivity" or other indicators of efficiency. There are several problems with simple numbers:
- Mean averages over 20 Hz to 20 kHz can be misleading.
- Industry measurement standards vary.
- Free-air response can have wide peaks that skew the result.
These are full range units. In most Lowther speakers there is no need to match multiple drivers.
For the occasional case where a Lowther is used as a midrange in a multi-way loudspeaker, the efficiency should be calculated over the actual operating band. We expect constructors of these systems to be competent in that process.
Because the calculated average from 20 Hz to 20 kHz is not very useful, one common industry standard is to test with pink noise between 500 Hz and 2 kHz. This gives a more meaningful indication. (See the standard calibration section where the PM6A unit is quoted at 95.7 dBA at 1 V between 500 Hz and 2000 Hz.)
Given that all Lowther units are more than adequate in efficiency, the character of each driver is best shown comparatively, using the well known PM6A as a baseline.
Note that 15 Ω units are generally 3 to 4 dB less efficient than the equivalent 8 Ω versions.
Settling in and diaphragm behaviour
The next graph shows how the frequency response smooths out after a settling in period.
This effect is more pronounced over a shorter time with the Sinfonia and Philharmonic range, while the Concert diaphragms typically take a few weeks to stabilise.
There is no useful data difference between Sinfonia and Philharmonic in the conventional measurements. The impedance and SPL graphs are effectively the same, so a single example can serve both in comparative illustrations against the Concert units.
Further comparative SPL plots for the Philharmonic and Concert ranges demonstrate the close similarity in measured response and the small refinements introduced by the premium constructions.

Why the Philharmonic exists when the curves look the same?
Philharmonic evaluation
If the measured data for the Sinfonia and Philharmonic looks almost identical, why do we offer these variants at all.
The answer is that impedance and frequency SPL data can only tell part of the story. They are very limited in predicting how a driver actually sounds.
Beyond the improved appearance that comes from closer attention to engineering and finishing, the Philharmonic range uses aluminium die cast frames that are machined so that axial planes are parallel to very tight tolerances. The diaphragm therefore moves with better planar accuracy. This reduces physical and musical distortion.
Pairs can then be hand picked from the machining tolerances for optimum stereo matching.
The T/S parameters derived from the impedance test are practically identical to the Sinfonia. The audible result is different. Micro detail and soundstage realism are improved. Only listening will reveal the difference.
Coil wire and nominal impedance choices
Variants of voice coil construction will produce subtle differences in presentation. As noted above, the usual published data is very limited in predicting how a unit actually sounds.
Because there are many variants, it is impractical and often confusing to publish separate impedance and SPL graphs for each coil type. Most customers who ask for guidance rely on listening and description rather than graphics, so the list below is a useful reference. The 8 Ω aluminium coil is the default and is used as the baseline.
Most customers who visit our showroom can make a decision based on comparative listening.
Aluminium 8Ω
7.4 DCR. Low mass, fast h/f detail; closest to Voigt's original ideal coil/diaphragm ratio.
Silver 8Ω
6.1 DCR. 'Softer' high frequencies, generally smoother presentation. Tougher, heavier wire, so not as delicate coil as aluminium for same resistance. Good match with supertweeters.
15Ω sil/alu
13 DCR. More turns = thinner wire to reduce mass, so more delicate coil. Matches 'fussy', usually older valve amps. Twin-driver systems present 8ohm as parallel wired (4Ω for 2x 8Ω).
Summary
Recent improvements and developments have made Lowther loudspeakers unparalleled for pure musical experience. Our aim now is to shift the focus from overwhelming technical data to getting people in front of the music.
We are confident that a personal listening session says far more about Lowther than any graph.
For that reason:
- Frequency response, impedance and impulse plots will not be available to download for all variants.
- Full data will be published for the Concert DX3 and PM6A units, with overlayed frequency response plots of other variants for at-a-glance comparison, for example DX2, DX3, DX4 efficiency and Concert vs Sinfonia.
- Test data for Sinfonia and Philharmonic should be regarded as essentially the same.
- Requests for specific information will always be supported where possible. Older test plots are archived but may no longer be fully relevant.
- Field coil, Philharmonic and Grand Opera instruments can only be appreciated by listening. Specification enquiries for these should ideally form part of an audition at one of our listening rooms, where we can give you our full attention.